Solar Data & Benchmarks
for Europe
CAPEX, OPEX, LCOE, PPA, performance and risk: useful benchmarks to compare European solar markets and support investment decisions.
📊 Solar Dashboard
Spot electricity price 🇫🇷
48.5
€/MWh — France day-ahead
RTE / EPEX Spot
Solar LCOE EU
40–55
€/MWh
BNEF / Fraunhofer ISE
EU PV Capacity
406
GW
SolarPower Europe
PV Module price
0.09–0.11
€/Wp (TOPCon)
PV InfoLink / BNEF
📰 News & Market Watch
Analysis and solar market trends
EU: 406 GW installed, but contraction ahead
The EU exceeded its 380 GW target with 406 GW by end of 2025. But SolarPower Europe warns of a 2026-2027 slowdown: residential dropped from 28% to 14% of the market. Return to 2025 levels expected only by 2030.
Source: SolarPower EuropeSolar LCOE: -97% since 2010, another -30% by 2035
BloombergNEF forecasts an additional 30% drop in solar LCOE by 2035. Despite an anomalous 6% rise in 2025 ($39/MWh), solar remains the world's most competitive power source.
Source: BloombergNEF, Wood MackenzieFrance PPE3: 54-59 GW of PV by 2030
France's new energy plan (PPE3), published in February 2026, targets 54-59 GW of installed PV by 2030 and up to 98 GW by 2035. France connected a record 5.9 GW in 2025 (+28% vs 2024), bringing total capacity to 31 GW.
Source: French Ministry of Energy TransitionKey Solar Figures
406 GW
EU Capacity
+65 GW in 2025
2.2 TW
Global Capacity
+600 GW in 2024
800k+
EU Solar Jobs
SolarPower Europe 2024
€45
LCOE /MWh
-89% since 2010
Sources: RTE, IRENA, SER, Observ'ER 2024
Data Hub
European solar benchmarks compiled from institutional public sources
CAPEX Europe
Investment costs by country and segment
LCOE Europe
Levelized cost of solar energy
PPA Prices Europe
Corporate power purchase agreements
WACC Europe
Cost of capital by country
OPEX Europe
O&M costs and maintenance
Market Power
Cannibalization, negative prices, curtailment
All Benchmarks
Overview of all available data
Explore the Site
Technical and economic analysis, interactive tools to understand the solar market
Solar Technologies
PERC, TOPCon, HJT, perovskites, agrivoltaics, battery storage
Market & Risks
Economics, markets, risks, bankability, country comparison
Data & Benchmarks
CAPEX, OPEX, LCOE, PPA, WACC by country
Insights
LCOE analysis, PPA trends, European solar market insights
Interactive Tools
Profitability calculator, irradiation map, comparator
Resources
FR/EN Glossary, reference sources, FAQ
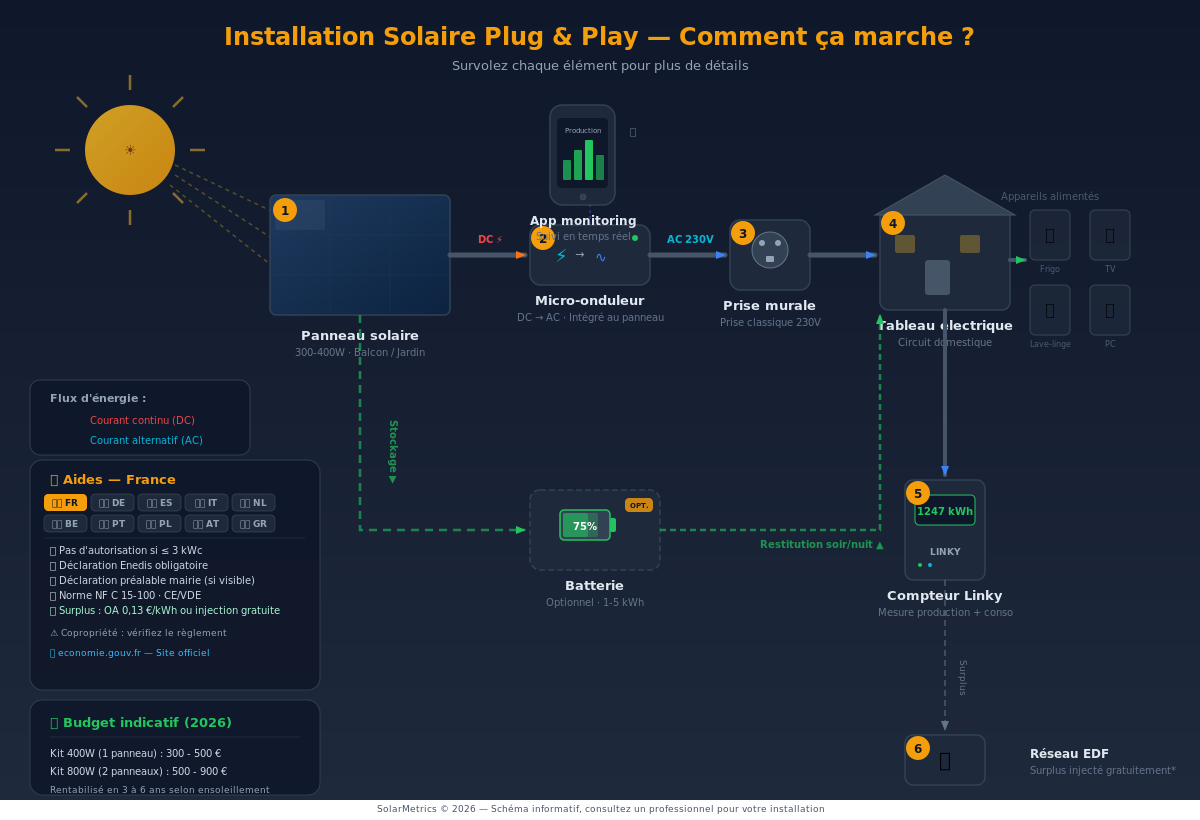
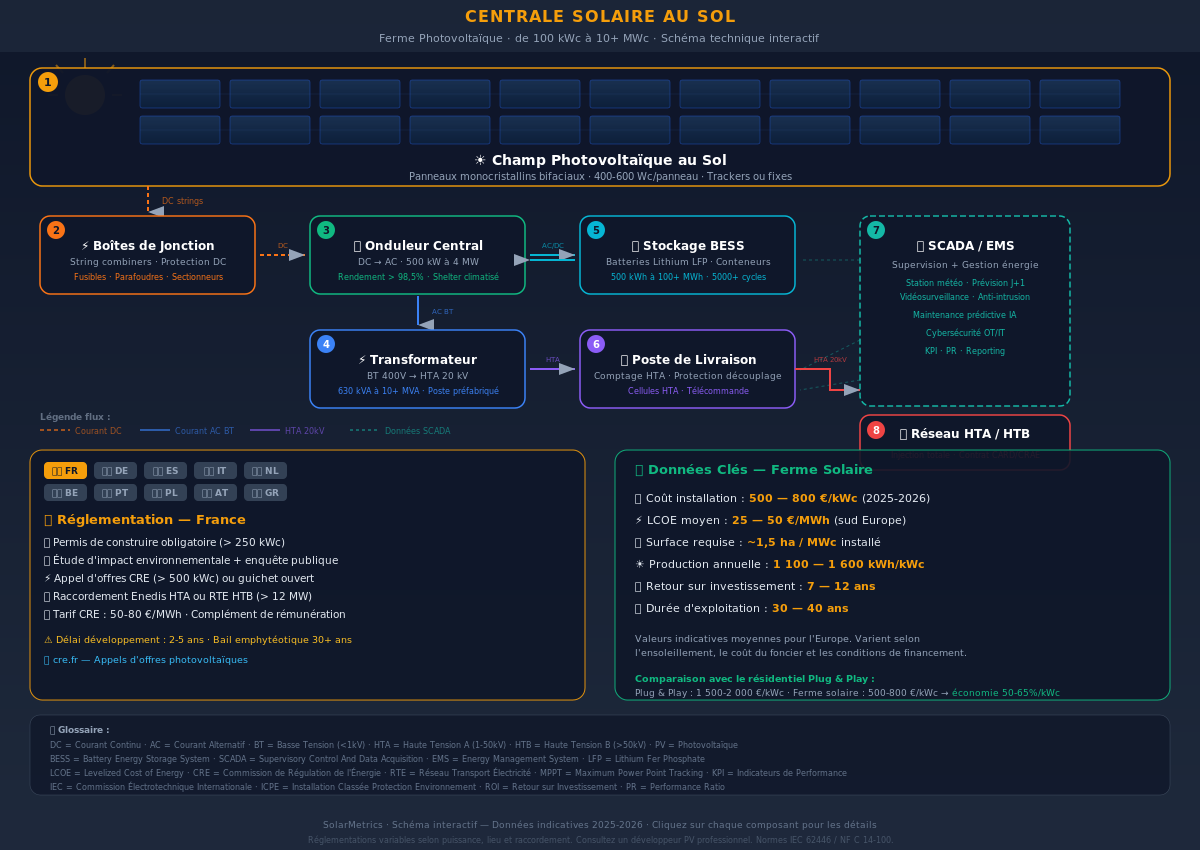
Interactive Installation Diagrams
Bernard Pugnet
Solar Finance, Risk & Performance
Senior finance, risk and performance professional, now focused on solar asset analysis, project metrics and European markets. Data on this site is compiled from institutional public sources.
View my LinkedIn profile